The model had memorised the map
 Aman Singh
Originally published at amansinghnp.com. The depth classifier in my Kaggle notebook looked accurate....
Originally published at amansinghnp.com.
The depth classifier in my Kaggle notebook looked accurate. It tells deep earthquakes from shallow ones using only where and when they happened, and on a random 80/20 split it scored 0.856 accuracy and an AUC of 0.909. When I tested it on regions it had never seen, holding out whole 10° cells, the AUC fell to 0.695, towards the 0.5 of chance. Accuracy dropped to 0.801, level with always answering "shallow", and it found one deep event in six. It had learned where deep earthquakes have already happened, not how to find a subduction zone.
The notebook covers 23,409 significant earthquakes (magnitude 5.5 and above) from 1965 to 2016 [1] and runs in 47 seconds. Its summary made three claims. This report keeps two things apart: Part 1 is what the original notebook did and showed, and Part 2 is the 2026 re-check, where I rebuilt the event table from the notebook's own output and tested each claim. The three results, each linked to its section:
| The notebook claimed | The re-check found | Key number |
|---|---|---|
| Events above M8.0 release "the vast majority" of the energy | Holds, but loosely. Sixteen events released half the energy; the 40 events of M8.0 or more released 60.2%. | 16 events, 50% |
| Aftershocks decay "consistent with Omori's Law" | Never tested: the notebook plots the Sumatra sequence and fits nothing. An Omori–Utsu fit I ran afterwards gives ordinary decay exponents. | p = 0.90 and 1.16 |
| The classifier can "accurately distinguish" deep from shallow | It memorised the map. On regions it had never seen, it falls towards chance. | AUC 0.909 → 0.695 |
Part 1: the original notebook
This part is what the notebook did and printed. The only thing I've added is the region names in the hotspot table.
The data is the USGS "Significant Earthquakes, 1965–2016" file on Kaggle. Cleaning joins the date and time columns into a timestamp, coerces coordinates, depth and magnitude to numbers, and drops rows missing any of them, leaving 23,409 events. Each event also gets an energy estimate. The rest of the notebook is six sections:
- an animated Plotly map, one frame per year, with bubble size set to magnitude cubed;
- cumulative energy over time, with the three largest events annotated;
- the aftershock timeline of the largest event, 2004 Sumatra (M9.1), within 500 km and 30 days;
- a 5° × 5° grid ranked by an intensity score, drawn as a density map with the PB2002 plate boundaries on top [2];
- an explorer filtered by minimum magnitude and a deep-focus switch (below 300 km);
- a random forest that classifies events as deep (70 km or more) or shallow from latitude, longitude, year and month.
Energy over time
Energy comes from the Gutenberg–Richter energy–magnitude relation [3]:
log10 E = 1.5 M + 4.8 (E in joules)
Each step of one magnitude unit is about 32 times the energy, so a catalogue that is mostly M5.5 to M6 will have its energy budget set by a handful of great earthquakes. The cumulative curve shows it: a slow ramp for 40 years, then three steps.
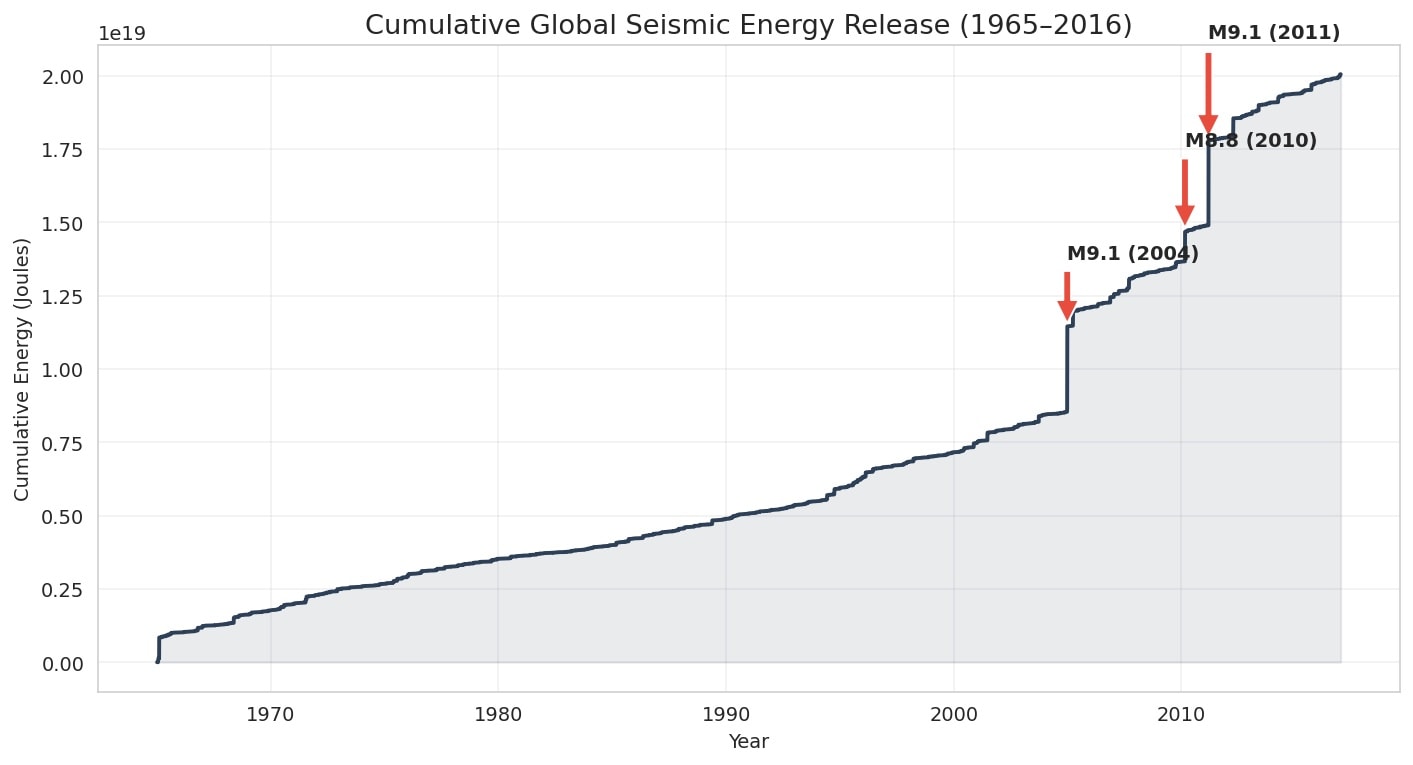
Figure 1, from the notebook. Cumulative energy release. The 2004, 2010 and 2011 earthquakes together account for a third of the 52-year total.
The notebook's markdown says the top 20 events account for "a disproportionate share" but never prints the share. Its summary goes further and says events above M8.0 account for "the vast majority" of the energy.
The Sumatra aftershocks
The notebook plots the Sumatra sequence within 500 km and 30 days of the mainshock and stops there. Its summary says aftershock sequences "exhibit predictable decay patterns consistent with Omori's Law".
Hotspots
Events are binned into 5° cells, and each cell gets a score of ln(1 + count) × maximum magnitude. The top ten:
| Cell (lat, lon) | Region | Events | Max M | Mean depth (km) |
|---|---|---|---|---|
| 35, 140 | Japan Trench, Honshu | 587 | 9.1 | 33 |
| −10, 150 | New Britain, Papua New Guinea | 654 | 8.0 | 48 |
| −15, 165 | Vanuatu | 594 | 8.0 | 67 |
| −20, −175 | Tonga | 534 | 8.1 | 52 |
| −25, −180 | Fiji deep zone | 583 | 7.8 | 328 |
| 40, 145 | Off Hokkaido | 388 | 8.3 | 43 |
| 0, 125 | Molucca Sea | 558 | 7.7 | 58 |
| 0, 95 | Northern Sumatra | 193 | 9.1 | 39 |
| −30, −180 | Kermadec | 366 | 8.0 | 63 |
| 45, 150 | Kuril Islands | 275 | 8.3 | 45 |
All ten are subduction zones on the western Pacific or in Indonesia. The notebook printed only coordinates; the region names are mine. The Fiji cell's mean depth of 328 km is the one place in the top ten where deep-focus earthquakes dominate.
The depth classifier
The label is deep if the focal depth is 70 km or more (the markdown says "greater than 70"; the code uses ≥). 20.3% of events are deep. Features are latitude, longitude, year and month, with depth and magnitude deliberately left out. The model is a scikit-learn random forest [6] with 100 trees capped at depth 10, trained on a random 80/20 split. The hypothesis in the notebook was that deep earthquakes only happen at subduction zones, so location alone should predict depth, and the model would act as "a proxy for identifying tectonic boundaries without explicit plate data". This is what it reported:
| Class | Precision | Recall | F1 | Support |
|---|---|---|---|---|
| Shallow | 0.852 | 0.990 | 0.916 | 3,709 |
| Deep | 0.901 | 0.346 | 0.500 | 973 |
| Accuracy | 0.856 | 4,682 |
On that basis the notebook's summary says the classifier can "accurately distinguish" the two regimes.
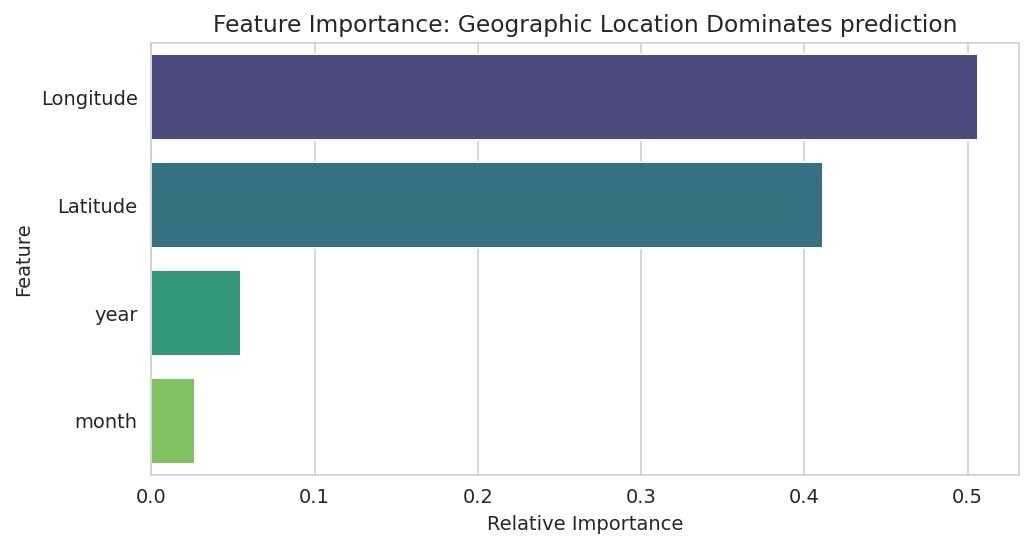
Figure 2, from the notebook. Feature importance. Year and month together take 8%, which should be close to zero for a question about plate geometry.
Part 2: the 2026 re-check
For the re-check I rebuilt the event table from the notebook's own output and tested each claim against it. Every table and chart from here on is mine, not the notebook's.
The first thing I found was a missing cleaning step. The source file has a Type column that separates earthquakes from nuclear explosions, and the notebook never reads it. At least 125 events sit on the Semipalatinsk, Novaya Zemlya and Nevada test sites at depths of 0 to 6 km. They barely move the energy totals, but they are in the hotspot counts and the classifier's shallow class.
Energy: the claim holds, loosely
Here is the share the notebook never printed:
| Largest events | Share of total energy |
|---|---|
| 1 (Sumatra, 2004) | 14.1% |
| 3 | 33.1% |
| 5 | 39.1% |
| 16 | 50.0% |
| 20 | 53.0% |
| 100 | 70.6% |
By magnitude band the imbalance is plainer still. Half the energy came from 0.07% of the events.

Figure 3, from the re-check. Where the energy is. Six events of M8.5 or above, 0.03% of the catalogue, radiated 41.6% of the energy. The 16,054 events below M6.0 radiated 1.7%.
So the claim that events above M8.0 account for "the vast majority" of the energy is directionally right but loose: 40 events, 0.17% of the catalogue, released 60.2%. That is a majority, not a vast one, because the M7.5 to M7.9 band alone adds another 20%.
The notebook's animated map works against this finding. Bubble area is set to magnitude cubed, so an M9.1 is drawn about 4.5 times the size of an M5.5, when it released roughly 250,000 times the energy. On the map, the Sumatra earthquake looks like a slightly larger dot.
Aftershocks: the claim was never tested
Within the notebook's window of 500 km and 30 days there are 45 aftershocks of M5.5 or more, the largest M6.7, and 22 of them fall in the first day. That is what Omori decay looks like, but a scatter plot is not a test.
The window is also small for this earthquake. The Sumatra–Andaman rupture ran roughly 1,300 km north from the epicentre [4], so a 500 km circle around the epicentre misses much of it. Widening to 1,500 km roughly doubles the count, to 95.
I fitted the Omori–Utsu law, n(t) = K / (t + c)p [5], by maximum likelihood over a grid, to both M9.1 events in the catalogue, using 90 days and 1,000 km:
| Mainshock | Aftershocks (M5.5+) | In first day | p | c (days) |
|---|---|---|---|---|
| Sumatra, 26 Dec 2004 | 114 | 40 | 0.90 | 0.035 |
| Tohoku, 11 Mar 2011 | 220 | 134 | 1.16 | 0.041 |
Both exponents sit in the usual range of roughly 0.9 to 1.5 [5], so the claim survives. The caveats are real, though. With only M5.5+ events, the counts are small. Catalogues miss many aftershocks in the first hours, when waveforms overlap, which inflates c. And I report no uncertainty on p. This is a check, not a result.
Hotspots: what the score rewards
Two things about the notebook's score are worth knowing. Maximum magnitude carries as much weight as frequency, which is how northern Sumatra gets into the top ten with 193 events. And the grid splits single systems: Tonga–Kermadec takes three cells and Japan–Kuril three more, so the table understates how concentrated seismicity is.
The classifier: it memorised the map
Start with the numbers the notebook reported. Always answering "shallow" scores 0.792 on the same test set, so the model adds six points. It caught 337 of 973 deep events and missed 636. When it does say deep it is usually right (37 false alarms), which means the default 0.5 threshold is the main problem. The ranking is decent: AUC 0.909. Lowering the threshold to 0.3 gives recall 0.66 at precision 0.74; at 0.2, recall 0.88 at precision 0.50. Letting the trees grow past depth 10, on latitude and longitude alone, lifts the AUC to 0.945 and recall at 0.5 to 0.73.
The bigger problem is the split. A random split scatters every cluster across training and test sets. Aftershocks of the same mainshock, and the hundreds of events on the same slab, end up on both sides, so to label a test event the forest only has to remember what happened a few kilometres away. That tests interpolation within known seismic zones. It does not test the hypothesis, which is about recognising tectonic structure.
To test that, I grouped events into 10° cells and ran 5-fold cross-validation with whole cells held out, so every test event comes from a region the model has not seen [7]. I also ran a time split, training on 1965–2005 and testing on 2006–2016.

Figure 4, from the re-check. The same model, three ways of testing it. It holds up when tested on later years and falls towards chance when tested on places it has never seen.
| Evaluation | AUC | Deep recall at 0.5 | Accuracy | All-shallow baseline |
|---|---|---|---|---|
| Random 80/20 (notebook) | 0.909 | 0.346 | 0.856 | 0.792 |
| Time split, test 2006–2016 | 0.906 | 0.316 | 0.877 | 0.827 |
| Unseen 10° cells, 5-fold | 0.695 ± 0.082 | 0.168 | 0.801 | ≈ 0.80 |
The time split barely moves anything, because subduction zones do not move in fifty years. Held-out regions are different: accuracy falls to the baseline and the model finds one deep event in six. What it learned is a lookup table of where deep earthquakes have already happened. That is a fair thing to know, but it is not a way to find plate boundaries without plate data, and a random split could not have told me so.
What I would change
- Filter to
Type == "Earthquake"before anything else. - Print the energy shares instead of describing them, and say "majority" where the number is 60%.
- Scale map bubbles by energy, or state on the chart that they are not.
- Fit Omori–Utsu with a completeness cut and confidence intervals, or drop the claim from the summary.
- Evaluate the classifier with spatially grouped folds, report recall and AUC next to a baseline, and drop year and month.
- Recast the classifier's goal: predict depth for new events in known zones, which it can do, rather than find boundaries, which it cannot.
- Use one magnitude type for energy. The catalogue mixes Mw, Ms and mb, and body-wave magnitudes saturate for large events.
A model can look accurate just by memorising where things happen. Test it somewhere it hasn't seen.
References
- U.S. Geological Survey. Significant Earthquakes, 1965–2016. Kaggle dataset.
- Bird, P. (2003). An updated digital model of plate boundaries. Geochemistry, Geophysics, Geosystems, 4(3), 1027. doi:10.1029/2001GC000252.
- Gutenberg, B. and Richter, C. F. (1956). Magnitude and energy of earthquakes. Annali di Geofisica, 9, 1–15.
- Lay, T. et al. (2005). The great Sumatra–Andaman earthquake of 26 December 2004. Science, 308(5725), 1127–1133. doi:10.1126/science.1112250.
- Utsu, T., Ogata, Y. and Matsu'ura, R. S. (1995). The centenary of the Omori formula for a decay law of aftershock activity. Journal of Physics of the Earth, 43(1), 1–33. doi:10.4294/jpe1952.43.1.
- Pedregosa, F. et al. (2011). Scikit-learn: Machine Learning in Python. Journal of Machine Learning Research, 12, 2825–2830.
- Roberts, D. R. et al. (2017). Cross-validation strategies for data with temporal, spatial, hierarchical, or phylogenetic structure. Ecography, 40(8), 913–929. doi:10.1111/ecog.02881.
Code & data
• Spatiotemporal Analysis of Global Seismicity (Kaggle notebook, Apache 2.0)
• Significant Earthquakes, 1965–2016 (USGS, via Kaggle)
This article was first published at amansinghnp.com.